LAPOP Bar Graphs
lapop_cccomb.RdThis function shows a bar graph for categorical variables using LAPOP formatting.
Usage
lapop_cccomb(
  cc1,
  cc2,
  subtitle1 = "",
  subtitle2 = "",
  main_title = "",
  source_info = "",
  lang = "en",
  color_scheme = "#784885",
  file_name = "",
  width_px = 895,
  height_px = 600
)
Arguments
- cc1, cc2
lapop_cc (ggplot) object. Graphic for left and right panes, respectively.
- subtitle1, subtitle2
Character. Describes the values/data shown in the graph, e.g., "Percent who agree that...". Default: None.
- main_title
Character. Title of graph. Default: None.
- source_info
Character. Information on dataset used (country, years, version, etc.), which is added to the end of "Source: LAPOP Lab" in the bottom-left corner of the graph. Default: None (only "Source: LAPOP Lab" will be printed).
- lang
Character. Changes default subtitle text and source info to either Spanish or English. Will not translate input text, such as main title or variable labels. Takes either "en" (English) or "es" (Spanish). Default: "en".
- color_scheme
Character. Color of bars. Takes hex numbers, beginning with "#". Default: "#008381".
- file_name
Character. If desired, supply file path + name to save graph.
- width_px, height_px
Numeric. Width and height of saved graph in pixels. Default: 895, 600.
Author
Luke Plutowski, luke.plutowski@vanderbilt.edu
Examples
# \donttest{
require(lapop); lapop_fonts()
#> LAPOP fonts loaded successfully: Inter and Inter Light.
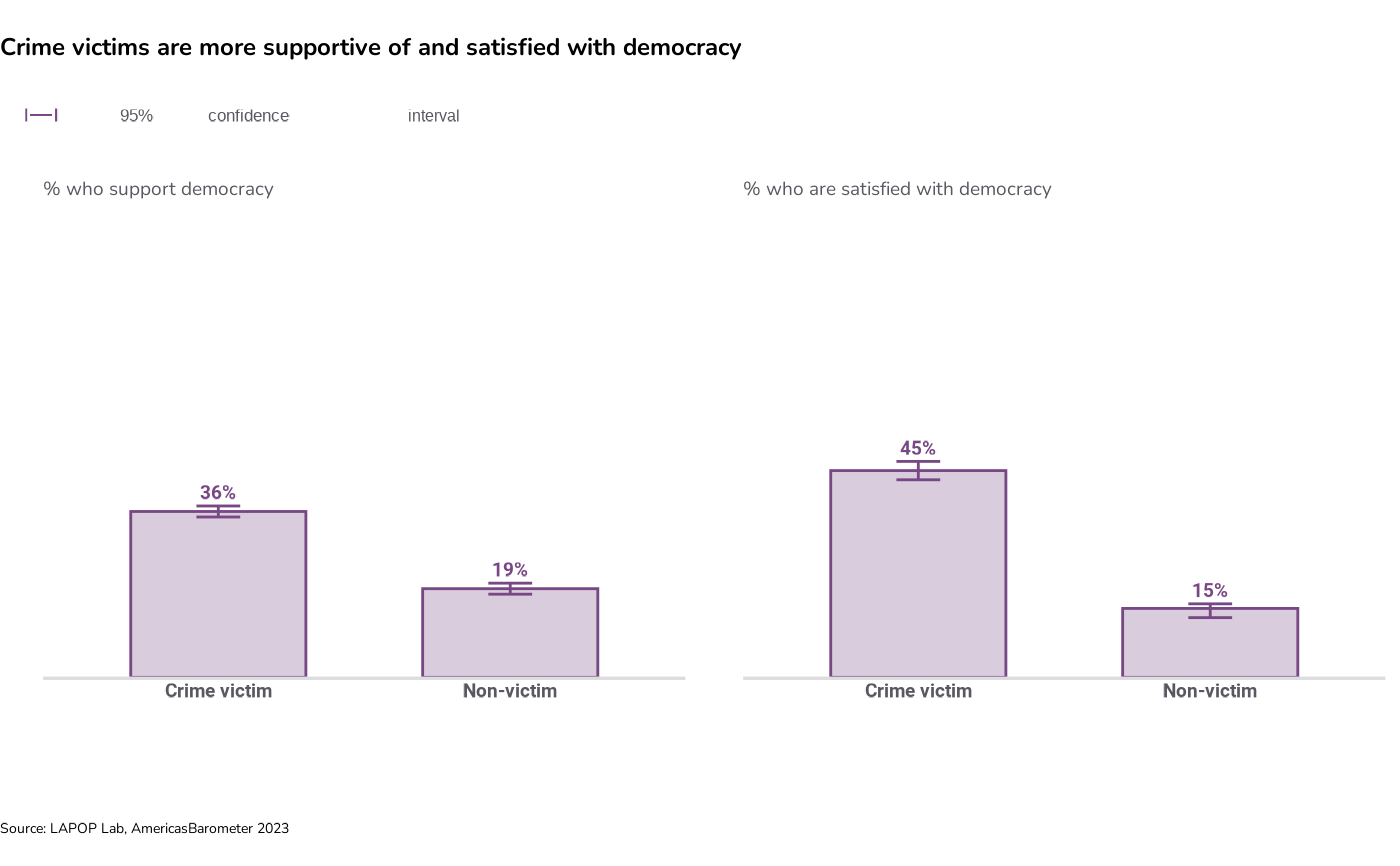
df1 <- data.frame(vallabel = c("Crime victim", "Non-victim"),
prop = c(36.1, 19.3),
proplabel = c("36%" ,"19%"),
lb = c(34.9, 18.1),
ub = c(37.3, 20.5))
df2 <- data.frame(vallabel = c("Crime victim", "Non-victim"),
prop = c(45, 15),
proplabel = c("45%" ,"15%"),
lb = c(43, 13),
ub = c(47, 16))
ccx <- lapop_cc(df1)
ccy <- lapop_cc(df2)
lapop_cccomb(ccx, ccy,
subtitle1 = "% who support democracy",
subtitle2 = "% who are satisfied with democracy",
main_title = "Crime victims are more supportive of and satisfied with democracy",
source_info = ", AmericasBarometer 2023")
#> Warning: font family 'nunito' not found, will use 'sans' instead
#> Warning: font family 'nunito' not found, will use 'sans' instead
#> Warning: font family 'nunito' not found, will use 'sans' instead
#> Warning: font family 'nunito' not found, will use 'sans' instead
#> Warning: font family 'nunito' not found, will use 'sans' instead
#> Warning: font family 'nunito' not found, will use 'sans' instead
#> Warning: font family 'nunito' not found, will use 'sans' instead
#> Warning: font family 'nunito' not found, will use 'sans' instead
#> Warning: font family 'nunito' not found, will use 'sans' instead
#> Warning: font family 'nunito' not found, will use 'sans' instead
#> Warning: font family 'nunito' not found, will use 'sans' instead
#> Warning: font family 'nunito' not found, will use 'sans' instead
#> Warning: font family 'nunito' not found, will use 'sans' instead
#> Warning: font family 'nunito' not found, will use 'sans' instead
#> Warning: font family 'nunito' not found, will use 'sans' instead
#> Warning: font family 'nunito' not found, will use 'sans' instead
#> Warning: font family 'nunito' not found, will use 'sans' instead
#> Warning: font family 'nunito' not found, will use 'sans' instead
#> Warning: font family 'nunito' not found, will use 'sans' instead
#> Warning: font family 'nunito' not found, will use 'sans' instead
#> Warning: font family 'nunito' not found, will use 'sans' instead
#> Warning: font family 'nunito' not found, will use 'sans' instead
#> Warning: font family 'nunito' not found, will use 'sans' instead
#> Warning: font family 'nunito' not found, will use 'sans' instead
#> Warning: font family 'nunito' not found, will use 'sans' instead
#> Warning: font family 'nunito' not found, will use 'sans' instead
#> Warning: font family 'nunito' not found, will use 'sans' instead
#> Warning: font family 'nunito' not found, will use 'sans' instead
#> Warning: font family 'nunito' not found, will use 'sans' instead
#> Warning: font family 'nunito' not found, will use 'sans' instead
#> Warning: font family 'nunito' not found, will use 'sans' instead
#> Warning: font family 'nunito' not found, will use 'sans' instead
#> Warning: font family 'nunito' not found, will use 'sans' instead
#> Warning: font family 'nunito' not found, will use 'sans' instead
#> Warning: font family 'nunito' not found, will use 'sans' instead
#> Warning: font family 'nunito' not found, will use 'sans' instead
#> Warning: font family 'nunito' not found, will use 'sans' instead
#> Warning: font family 'nunito' not found, will use 'sans' instead
#> Warning: font family 'nunito' not found, will use 'sans' instead
#> Warning: font family 'nunito' not found, will use 'sans' instead
#> Warning: font family 'nunito' not found, will use 'sans' instead
#> Warning: font family 'nunito' not found, will use 'sans' instead
#> Warning: font family 'nunito' not found, will use 'sans' instead
#> Warning: font family 'nunito' not found, will use 'sans' instead
#> Warning: font family 'nunito' not found, will use 'sans' instead
#> Warning: font family 'nunito' not found, will use 'sans' instead
#> Warning: font family 'nunito' not found, will use 'sans' instead
#> Warning: font family 'nunito' not found, will use 'sans' instead
#> Warning: font family 'nunito' not found, will use 'sans' instead
#> Warning: font family 'nunito' not found, will use 'sans' instead
 # }
# }