LAPOP Cross-Country Bar Graphs
lapop_ccm.RdThis function creates bar graphs for comparing values across countries using LAPOP formatting.
Usage
lapop_ccm(
  data,
  pais = data$pais,
  outcome_var = data$prop,
  lower_bound = data$lb,
  upper_bound = data$ub,
  label_var = data$proplabel,
  var = data$var,
  ymin = 0,
  ymax = 100,
  lang = "en",
  main_title = "",
  source_info = "",
  subtitle = "",
  sort = "",
  y_label = "",
  x_label = "",
  highlight = "",
  color_scheme = c("#784885", "#008381", "#C74E49"),
  label_size = 4,
  text_position = 0.7
)
Arguments
- data
Data Frame. Dataset to be used for analysis. The data frame should have columns titled pais (values of x-axis variable (usually pais); character vector), prop (outcome variable; numeric), proplabel (text of outcome variable; character), lb (lower bound of estimate; numeric), ub (upper bound of estimate; numeric), and var (labels of secondary variables; character). Default: None (must be supplied).
- pais, outcome_var, label_var, lower_bound, upper_bound, var
Character, numeric, character, numeric, numeric, character. Each component of the plot data can be manually specified in case the default columns in the data frame should not be used (if, for example, the values for a given variable were altered and stored in a new column).
- ymin, ymax
Numeric. Minimum and maximum values for y-axis. Default: 0 to 100.
- lang
Character. Changes default subtitle text and source info to either Spanish or English. Will not translate input text, such as main title or variable labels. Takes either "en" (English) or "es" (Spanish). Default: "en".
- main_title
Character. Title of graph. Default: None.
- source_info
Character. Information on dataset used (country, years, version, etc.), which is added to the end of "Source: " in the bottom-left corner of the graph. Default: None (only "Source: " will be printed).
- subtitle
Character. Describes the values/data shown in the graph, e.g., "percentage of Mexicans who say...)". Default: None.
- sort
Character. Method of sorting bars. Options: "var1" (highest to lowest on variable 1), "var2" (highest to lowest on variable 2), "var3" (highest to lowest on variable 3), "alpha" (alphabetical along x-axis/pais). Default: Order of data frame.
- y_label
Character. Y-axis label.
- x_label
Character. X-axis label.
- highlight
Character. Country of interest. Will highlight (make darker) that country's bar. Input must match entry in "vallabel" exactly. Default: None.
- color_scheme
Character. Color of bars. Takes hex number, beginning with "#". Default: "#784885", "#008381", "#C74E49".
- label_size
Numeric. Size of text for data labels (percentages above bars). Default: 4.
- text_position
Numeric. Amount that text above error bars should be offset (to avoid overlap). Default: 0.7
Value
Returns an object of class ggplot, a ggplot figure showing
average values of some variables across multiple countries.
Author
Luke Plutowski, luke.plutowski@vanderbilt.edu & Robert Vidigal, robert.vidigal@vanderbilt.edu
Examples
# \donttest{
require(lapop); lapop_fonts()
#> LAPOP fonts loaded successfully: Inter and Inter Light.
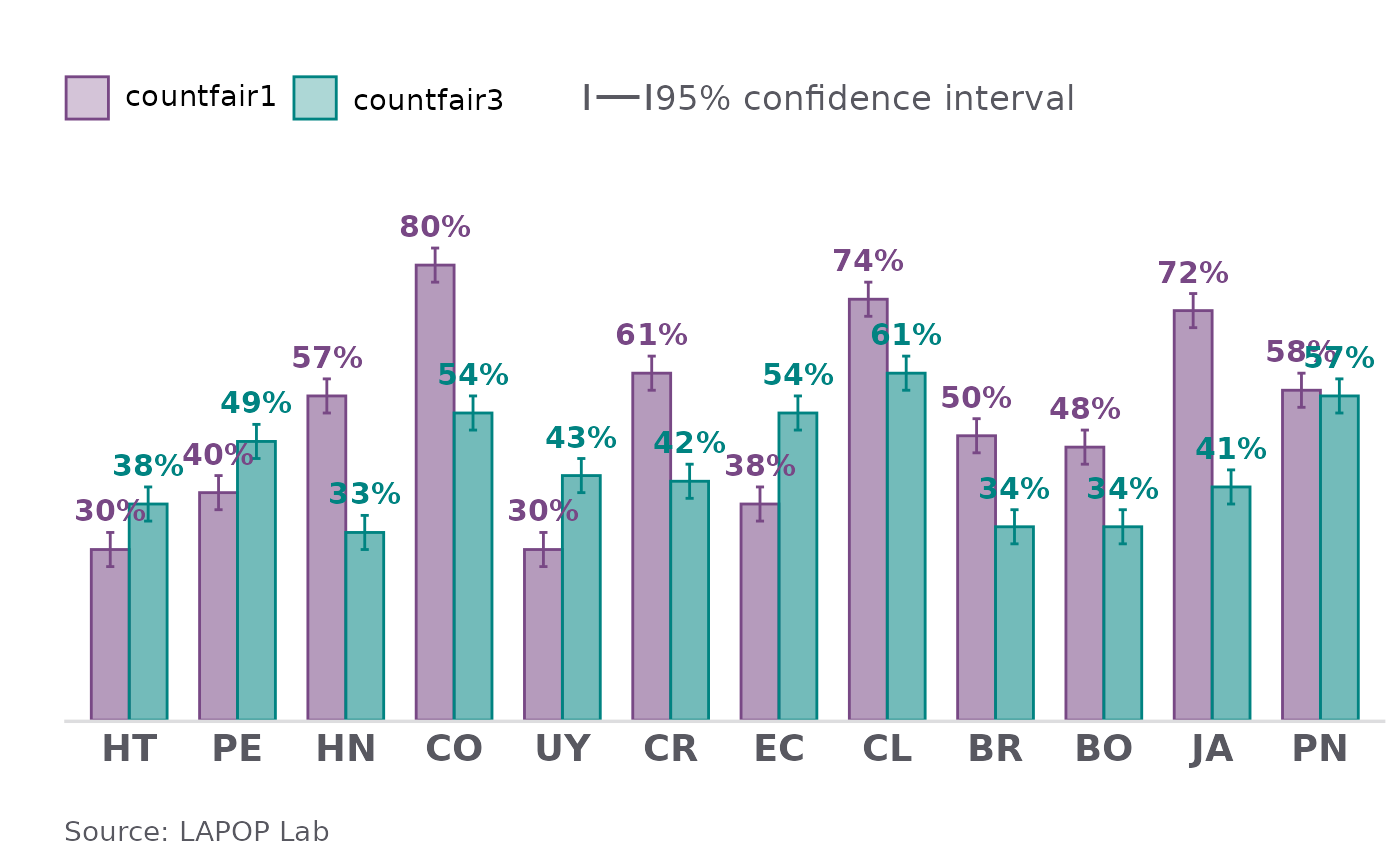
df <- data.frame(pais = c(rep("HT", 2), rep("PE", 2), rep("HN", 2), rep("CO", 2),
rep("UY", 2), rep("CR", 2), rep("EC", 2), rep("CL", 2),
rep("BR", 2), rep("BO", 2), rep("JA", 2), rep("PN", 2)),
var = rep(c("countfair1", "countfair3"), 3),
prop = c(30, 38, 40, 49, 57, 33, 80, 54, 30, 43, 61, 42,
38, 54, 74, 61, 50, 34, 48, 34, 72, 41, 58, 57),
proplabel = c("30%", "38%", "40%", "49%", "57%", "33%",
"80%", "54%", "30%", "43%", "61%", "42%",
"38%", "54%", "74%", "61%", "50%", "34%",
"48%", "34%", "72%", "41%", "58%", "57%"),
lb = c(27, 35, 37, 46, 54, 30, 77, 51, 27, 40, 58, 39,
35, 51, 71, 58, 47, 31, 45, 31, 69, 38, 55, 54),
ub = c(33, 41, 43, 52, 60, 36, 83, 57, 33, 46, 64, 45,
41, 57, 77, 64, 53, 37, 51, 37, 75, 44, 61, 60))
lapop_ccm(df, sort = "var", source_info = ", AmericasBarometer")
 # }
# }