LAPOP Dummbell Graphs
lapop_dumb.RdThis function creates "dumbbell" graphs, which show averages for a variable across countries over two time periods, using LAPOP formatting.
Usage
lapop_dumb(
  data,
  ymin = 0,
  ymax = 100,
  lang = "en",
  main_title = "",
  source_info = "",
  subtitle = "",
  sort = "wave2",
  order = "hi-lo",
  color_scheme = c("#008381", "#A43D6A"),
  subtitle_h_just = 40,
  subtitle_v_just = -18,
  text_nudge = 6,
  drop_singles = FALSE
)
Arguments
- data
Data Frame. Dataset to be used for analysis. The data frame should have columns titled pais (country name; character), wave1 (name of first wave/year (all rows are the same); character), prop1 (outcome variable values for the first wave; numeric), proplabel1 (text of outcome variable for first wave; character), wave2 (name of second wave/year (all rows are the same); character), prop2 (outcome variable values for the second wave; numeric), proplabel2 (text of outcome variable for second wave; character). Default: None (must be supplied).
- ymin, ymax
Numeric. Minimum and maximum values for y-axis. Defaults: 0 and 100.
- lang
Character. Changes default subtitle text and source info to either Spanish or English. Will not translate input text, such as main title or variable labels. Takes either "en" (English) or "es" (Spanish). Default: "en".
- main_title
Character. Title of graph. Default: None.
- source_info
Character. Information on dataset used (country, years, version, etc.), which is added to the end of "Source: " in the bottom-left corner of the graph. Default: LAPOP (only "Source: "LAPOP Lab will be printed).
- subtitle
Character. Describes the values/data shown in the graph, e.g., "Percent who agree that...". Default: None.
- sort
Character. The metric by which the data are sorted. Options: "wave1" (outcome variable in first wave), "wave2" (outcome variable in wave 2), "diff" (difference between the two waves), "alpha" (alphabetical by country name). Default: "wave2".
- order
Whether data should be sorted from low to high or high to low on the sort metric. Options: "hi-lo" and "lo-hi". Default: "hi-lo".
- color_scheme
Character. Color of data points. Must supply two values. Takes hex numbers, beginning with "#". Default: "#482677", "#3CBC70".
- subtitle_h_just, subtitle_v_just
Numeric. Move the subtitle/legend text left/down (negative numbers) or right/up (positive numbers). Ranges from -100 to 100. Defaults: 40, -18.
- text_nudge
Numeric. Move text of data further or closer to data point. Default: 6.
- drop_singles
Logical. Should rows with only one dot be removed? Default: FALSE.
Value
Returns an object of class ggplot, a ggplot figure showing
average values of some variable in two time periods across multiple countries
(a dumbbell plot).
Author
Luke Plutowski, luke.plutowski@vanderbilt.edu & Robert Vidigal, robert.vidigal@vanderbilt.edu
Examples
# \donttest{
require(lapop); lapop_fonts()
#> LAPOP fonts loaded successfully: Inter and Inter Light.
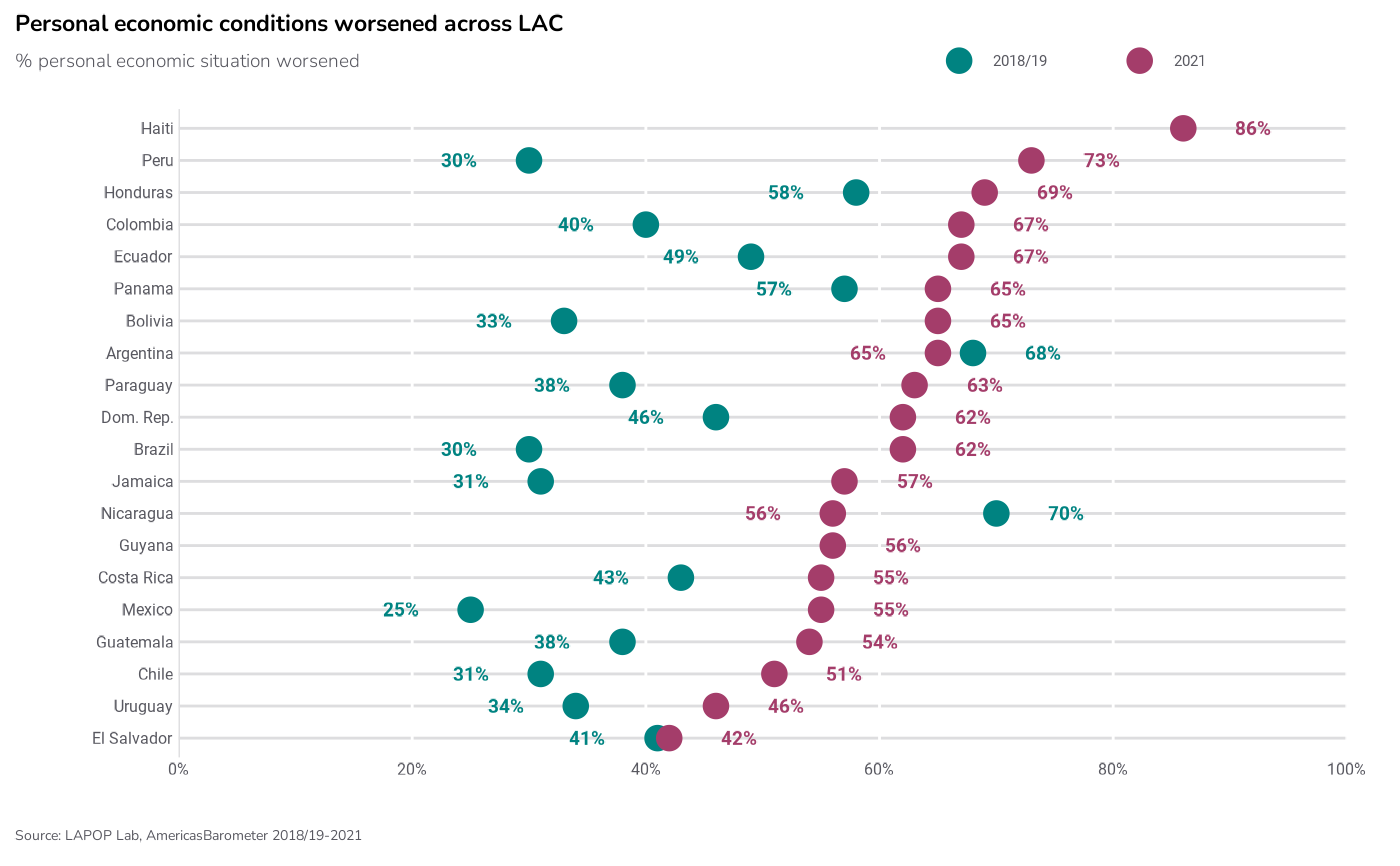
df <- data.frame(pais = c("Haiti", "Peru", "Honduras", "Colombia", "Ecuador",
"Panama", "Bolivia", "Argentina", "Paraguay",
"Dom. Rep.", "Brazil", "Jamaica", "Nicaragua",
"Guyana", "Costa Rica", "Mexico", "Guatemala",
"Chile", "Uruguay", "El Salvador"),
wave1 = rep("2018/19", 20),
prop1 = c(NA, 30, 58, 40, 49, 57, 33, 68, 38, 46, 30,
31, 70, NA, 43, 25, 38, 31, 34, 41),
proplabel1 = c(NA, "30%", "58%", "40%", "49%", "57%", "33%",
"68%", "38%", "46%", "30%", "31%", "70%", NA,
"43%", "25%", "38%", "31%", "34%", "41%"),
wave2 = rep("2021", 20),
prop2 = c(86, 73, 69, 67, 67, 65, 65, 65, 63, 62, 62,
57, 56, 56, 55, 55, 54, 51, 46, 42),
proplabel2 = c("86%", "73%", "69%", "67%", "67%", "65%", "65%",
"65%", "63%", "62%", "62%", "57%", "56%", "56%",
"55%", "55%", "54%", "51%", "46%", "42%"))
lapop_dumb(df,
main_title = paste0("Personal economic conditions worsened across LAC"),
subtitle = "% personal economic situation worsened",
source_info = "Source: LAPOP Lab, AmericasBarometer 2018/19-2021")
#> Warning: Removed 2 rows containing missing values or values outside the scale range
#> (`geom_segment()`).
 # }
# }