LAPOP Bar Graphs
lapop_hist.RdThis function shows a bar graph for categorical variables using LAPOP formatting.
Usage
lapop_hist(
  data,
  outcome_var = data$prop,
  label_var = data$proplabel,
  cat_var = data$cat,
  ymin = 0,
  ymax = 100,
  lang = "en",
  main_title = "",
  subtitle = "",
  source_info = "LAPOP",
  order = FALSE,
  color_scheme = "#008381"
)
Arguments
- data
Data Frame. Dataset to be used for analysis. The data frame should have columns titled cat (labels of each category in variable; character), prop (outcome variable value; numeric), and proplabel (text of outcome variable value; character). Default: None (must be provided).
- cat_var, outcome_var, label_var
Character, numeric, character. Each component of the data to be plotted can be manually specified in case the default columns in the data frame should not be used (if, for example, the values for a given variable were altered and stored in a new column).
- ymin, ymax
Numeric. Minimum and maximum values for y-axis. Defaults: 0, 100.
- lang
Character. Changes default subtitle text and source info to either Spanish or English. Will not translate input text, such as main title or variable labels. Takes either "en" (English) or "es" (Spanish). Default: "en".
- main_title
Character. Title of graph. Default: None.
- subtitle
Character. Describes the values/data shown in the graph, e.g., "Percent who agree that...". Default: None.
- source_info
Character. Information on dataset used (country, years, version, etc.), which is added to the bottom-left corner of the graph. Default: LAPOP ("Source: LAPOP Lab" will be printed).
- order
Logical. Should bars be ordered from most frequent response to least? Default: FALSE.
- color_scheme
Character. Color of bars. Takes hex numbers, beginning with "#". Default: "#008381".
Author
Luke Plutowski, luke.plutowski@vanderbilt.edu & Robert Vidigal, robert.vidigal@vanderbilt.edu
Examples
# \donttest{
require(lapop); lapop_fonts()
#> LAPOP fonts loaded successfully: Inter and Inter Light.
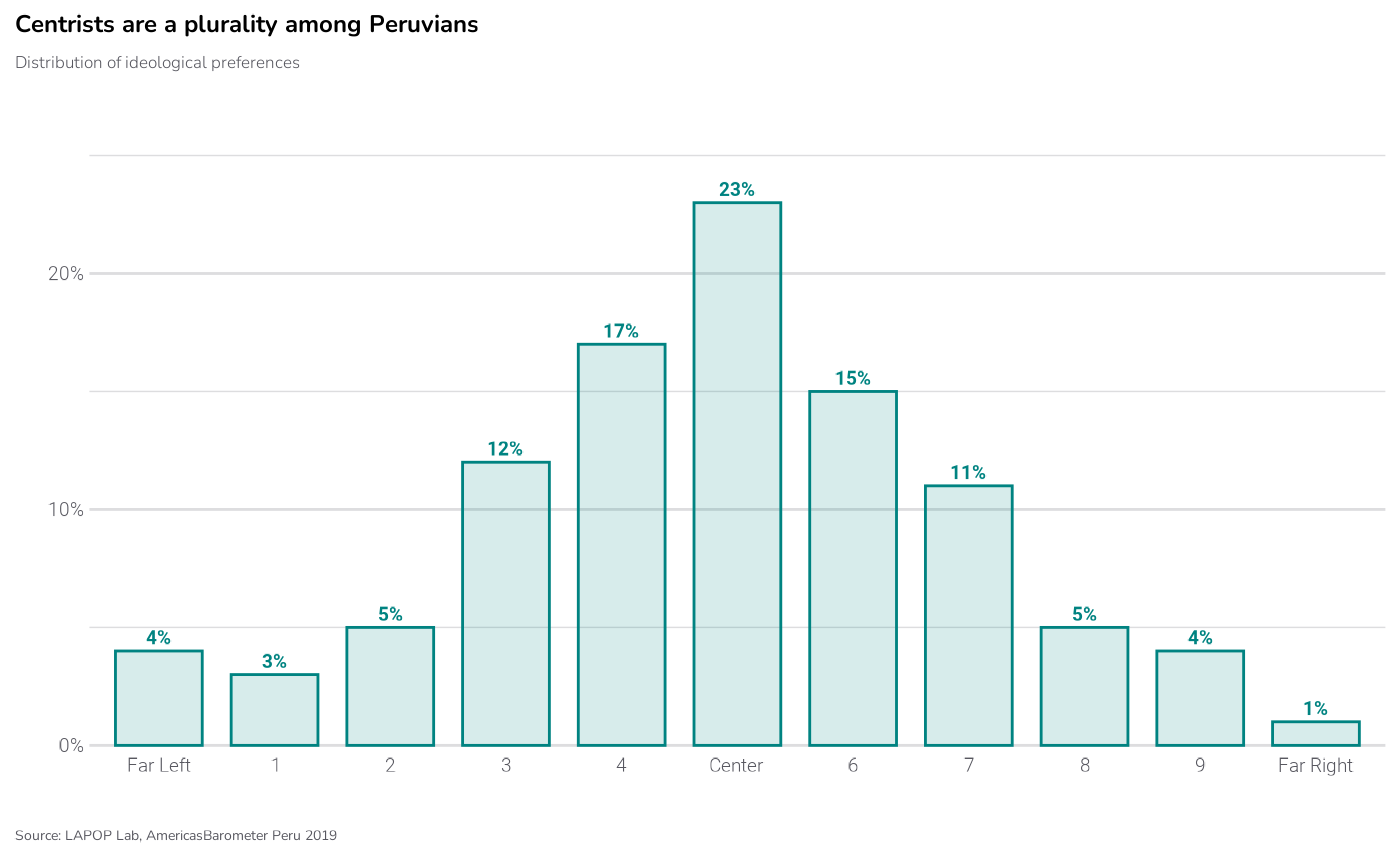
df <- data.frame(
cat = c("Far Left", 1, 2, 3, 4, "Center", 6, 7, 8, 9, "Far Right"),
prop = c(4, 3, 5, 12, 17, 23, 15, 11, 5, 4, 1),
proplabel = c("4%", "3%", "5%", "12%", "17%", "23%", "15%", "11%", "5%", "4%", "1%")
)
lapop_hist(df,
main_title = "Centrists are a plurality among Peruvians",
subtitle = "Distribution of ideological preferences",
source_info = "Source: LAPOP Lab, AmericasBarometer Peru 2019",
ymax = 27)
 # }
# }