LAPOP World and Americas Map Graph
lapop_map.RdThe `lapop_map()` generates a stylized choropleth map using ISO2 country codes from both continuous and factor variables. It is designed to map cross-country results from `lpr_cc()` and supports either a full world map (`survey = "CSES"`) # or an Americas-only map (`survey = "AmericasBarometer"`).
Arguments
- data
A data frame containing ISO2 country codes and a value to map.
- outcome
String. Column name containing the numeric or categorical variable to visualize.
- pais_lab
String. Column name containing ISO2 country codes (e.g., `"US"`, `"BR"`).
- survey
Either `"CSES"` (full world map) or `"AmericasBarometer"` (Americas only).
- zoom
Numeric (0–1). Controls how tightly the map zooms when `survey = "AmericasBarometer"`. Default is `1`.
- main_title
Character. Title of graph. Default: None.
- subtitle
Character. Describes the values/data shown in the graph, e.g., "percentage of Mexicans who say...)". Default: None.
- palette
Vector of up to 5 colors for continuous and factor variables.
- source_info
Character. Information on dataset used (country, years, version, etc.), which is added to the bottom-left corner of the graph. Default: LAPOP ("Source: LAPOP Lab" will be printed).
- lang
Character. Changes default subtitle text and source info to either Spanish or English. Will not translate input text, such as main title or variable labels. Takes either "en" (English) or "es" (Spanish). Default: "en".
- selected_countries
Character or NULL. ISO2 code of the currently selected country (e.g. from `input$pais` in Shiny). When not `NULL`, countries with no data are rendered with diagonal stripes instead of solid gray. Default: `NULL` (solid `"#dddddf"`).
Author
Robert Vidigal, robert.vidigal@vanderbilt.edu
Examples
# \donttest{
# Standalone — solid gray for no-data countries
lapop_fonts()
#> LAPOP fonts loaded successfully: Inter and Inter Light.
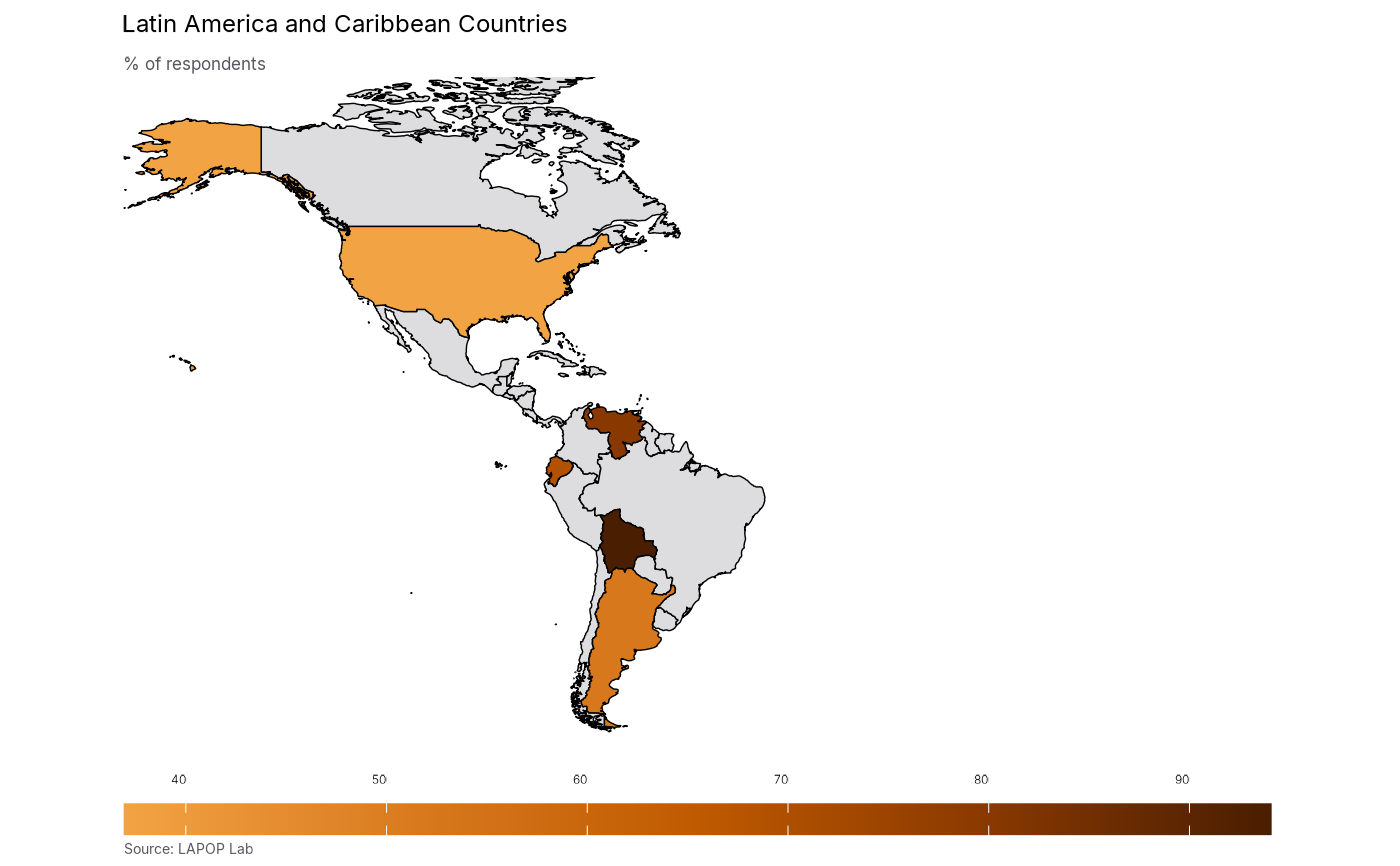
data_cont <- data.frame(
vallabel = c("US", "AR", "VE", "CH", "EC", "BO"),
prop = c(37, 52, 80, 17, 69, 94)
)
lapop_map(data_cont, pais_lab = "vallabel", outcome = "prop", zoom = 0.9,
survey = "AmericasBarometer", main_title = "Latin America and Caribbean Countries",
subtitle = "% of respondents")
 # }
if (interactive()) {
lapop_map(data_cont, pais_lab = "vallabel", outcome = "prop", zoom = 0.9,
survey = "AmericasBarometer", selected_countries = "BR")
}
# }
if (interactive()) {
lapop_map(data_cont, pais_lab = "vallabel", outcome = "prop", zoom = 0.9,
survey = "AmericasBarometer", selected_countries = "BR")
}