LAPOP Multi-line Time-Series Graphs
lapop_mline.RdThis function creates a time series graph utilizing multiple lines representing values of an outcome variable for different values of a secondary variable – for example, support for democracy over time by country. This function is designed to be used for AmericasBarometer data. The maximum number of lines is four. Unlike the lapop_ts() single-line time series graph, this function will not print confidence lines nor will it show text values for each year (just the final/most recent year).
Usage
lapop_mline(
  data,
  varlabel = data$varlabel,
  wave_var = as.character(data$wave),
  outcome_var = data$prop,
  label_var = data$proplabel,
  point_var = data$prop,
  ymin = 0,
  ymax = 100,
  main_title = "",
  source_info = "",
  subtitle = "",
  lang = "en",
  legend_h_just = 40,
  legend_v_just = -20,
  subtitle_h_just = 0,
  color_scheme = c("#784885", "#008381", "#c74e49", "#2d708e", "#a43d6a", "#202020"),
  percentages = TRUE,
  all_labels = FALSE,
  ci = FALSE,
  legendnrow = 1
)
Arguments
- data
Data Frame. Dataset to be used for analysis. The data frame should have columns titled varlabel (values of secondary variable which will be used to make each line; character), wave (survey wave/year; character), prop (outcome variable; numeric), proplabel (text of outcome variable; character). Default: None (must be supplied).
- varlabel, wave_var, outcome_var, label_var, point_var
Character, character, numeric, character, numeric. Each component of the data to be plotted can be manually specified in case the default columns in the data frame should not be used (if, for example, the values for a given variable were altered and stored in a new column).
- ymin, ymax
Numeric. Minimum and maximum values for y-axis. Default: 0, 100.
- main_title
Character. Title of graph. Default: None.
- source_info
Character. Information on dataset used (country, years, version, etc.), which is added to the end of "Source: " in the bottom-left corner of the graph. Default: None (only "Source: " will be printed).
- subtitle
Character. Describes the values/data shown in the graph, e.g., "Percent of Mexicans who agree...". Default: None.
- lang
Character. Changes default subtitle text and source info to either Spanish or English. Will not translate input text, such as main title or variable labels. #' Takes either "en" (English) or "es" (Spanish). Default: "en".
- legend_h_just, legend_v_just
Numeric. Changes location of legend. From 0 to 100. (secondary variable labels). Defaults: 40, -20.
- subtitle_h_just
Numeric. Moves subtitle left to right. From 0 to 1. (secondary variable labels). Defaults: 0 (left justify).
- color_scheme
Character. Color of lines and dots. Takes hex number, beginning with "#". Must specify four values, even if four are not used. Default: c("#784885", "#008381", "#c74e49", "#2d708e", "#a43d6a", "#202020").
- percentages
Logical. Is the outcome variable a percentage? Set to FALSE if you are using means of the raw values, so that the y-axis adjusts accordingly. Default: TRUE.
- all_labels
Logical. If TRUE, show text above all points, instead of only those in the most recent wave. Default: FALSE.
- ci
Logical. Add "tie fighter" confidence intervals. Only recommended when each line represents a different variable.
- legendnrow
Numeric. How many rows for legend labels. Default: 1.
Value
Returns an object of class ggplot, a ggplot line graph showing values of a variable over time.
Author
Luke Plutowski, luke.plutowski@vanderbilt.edu & Robert Vidigal, robert.vidigal@vanderbilt.edu
Examples
# \donttest{
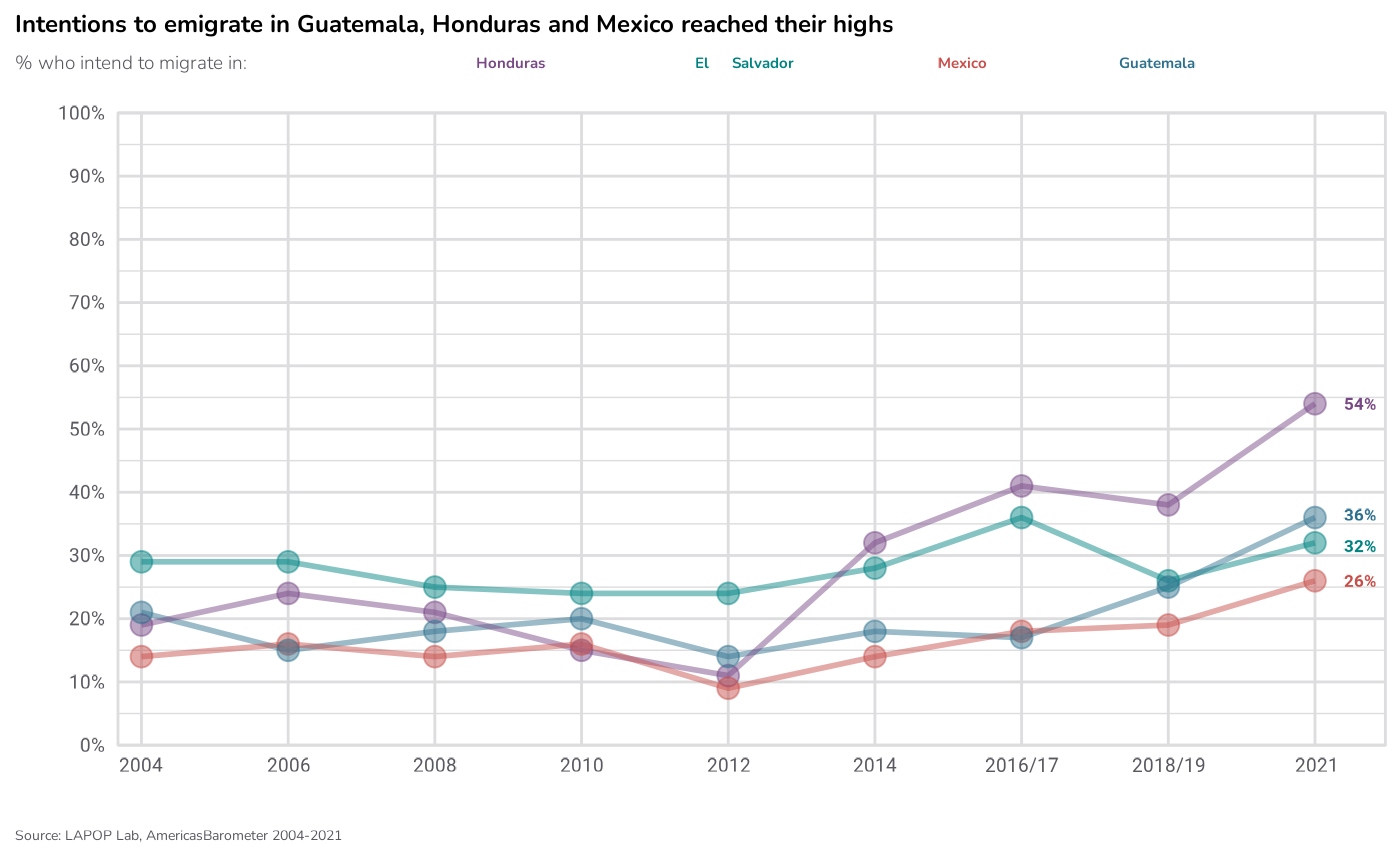
df <- data.frame(varlabel = c(rep("Honduras", 9), rep("El Salvador", 9),
rep("Mexico", 9), rep("Guatemala", 9)),
wave = rep(c("2004", "2006", "2008", "2010", "2012",
"2014", "2016/17", "2018/19", "2021"), 4),
prop = c(19, 24, 21, 15, 11, 32, 41, 38, 54,
29, 29, 25, 24, 24, 28, 36, 26, 32,
14, 16, 14, 16, 9, 14, 18, 19, 26,
21, 15, 18, 20, 14, 18, 17, 25, 36),
proplabel = c("19%", "24%", "21%", "15%", "11%", "32%",
"41%", "38%", "54%",
"29%", "29%", "25%", "24%", "24%", "28%",
"36%", "26%", "32%",
"14%", "16%", "14%", "16%", "9%", "14%",
"18%", "19%", "26%",
"21%", "15%", "18%", "20%", "14%", "18%",
"17%", "25%", "36%"))
require(lapop); lapop_fonts()
#> LAPOP fonts loaded successfully: Inter and Inter Light.
lapop_mline(df,
main_title = "Intentions to emigrate in Guatemala, Honduras and Mexico reached their highs",
subtitle = "% who intend to migrate in:",
source_info = ", AmericasBarometer 2004-2021")
#> Warning: Removed 32 rows containing missing values or values outside the scale range
#> (`geom_text_repel()`).
 # }
# }