LAPOP Multiple-Over/Breakdown Graphs
lapop_mover.RdThis function shows the values of an outcome variable for subgroups of a secondary variable, using LAPOP formatting.
Usage
lapop_mover(
  data,
  lang = "en",
  main_title = "",
  subtitle = "",
  qword = NULL,
  source_info = "LAPOP",
  rev_values = FALSE,
  rev_variables = FALSE,
  subtitle_h_just = 0,
  ymin = 0,
  ymax = 100,
  x_lab_angle = 90,
  color_scheme = c("#784885", "#008381", "#c74e49", "#2d708e", "#a43d6a")
)
Arguments
- data
Data Frame. Dataset to be used for analysis. The data frame should have columns titled varlabel (name(s)/label(s) of secondary variable(s); character), vallabel (names/labels of values for secondary variable; character), prop (outcome variable value; numeric), proplabel (text of outcome variable value; character), lb (lower bound of estimate; numeric), and ub (upper bound of estimate; numeric). Default: None (must be provided).
- lang
Character. Changes default subtitle text and source info to either Spanish or English. Will not translate input text, such as main title or variable labels. Takes either "en" (English) or "es" (Spanish). Default: "en".
- main_title
Character. Title of graph. Default: None.
- subtitle
Character. Describes the values/data shown in the graph, e.g., "Percent who agree that...". Default: None.
- qword
Character. Describes the question wording shown in the graph, e.g., "Do you agree that...". Default: NULL.
- source_info
Character. Information on dataset used (country, years, version, etc.), which is added to the bottom-left corner of the graph. Default: LAPOP ("Source: LAPOP Lab" will be printed).
- rev_values
Logical. Should the order of the values for each variable be reversed? Default: FALSE.
- rev_variables
Logical. Should the order of the variables be reversed? Default: FALSE.
- subtitle_h_just
Numeric. Move the subtitle/legend text left (negative numbers) or right (positive numbers). Ranges from -100 to 100. Default: 0.
- ymin, ymax
Numeric. Minimum and maximum values for y-axis. Defaults: 0 and 100.
- x_lab_angle
Numeric. Angle/orientation of the value labels. Default: 90.
- color_scheme
Character. Color of data points and text for each secondary variable. Allows up to 6 values. Takes hex numbers, beginning with "#". Default: c("#784885", "#008381", "#c74e49", "#2d708e", "#a43d6a") (purple, teal, green, olive, sap green, pea soup).
Value
Returns an object of class ggplot, a ggplot figure showing
average values of some variable broken down by one or more secondary variables
(commonly, demographic variables).
Author
Luke Plutowski, luke.plutowski@vanderbilt.edu & Robert Vidigal, robert.vidigal@vanderbilt.edu
Examples
# \donttest{
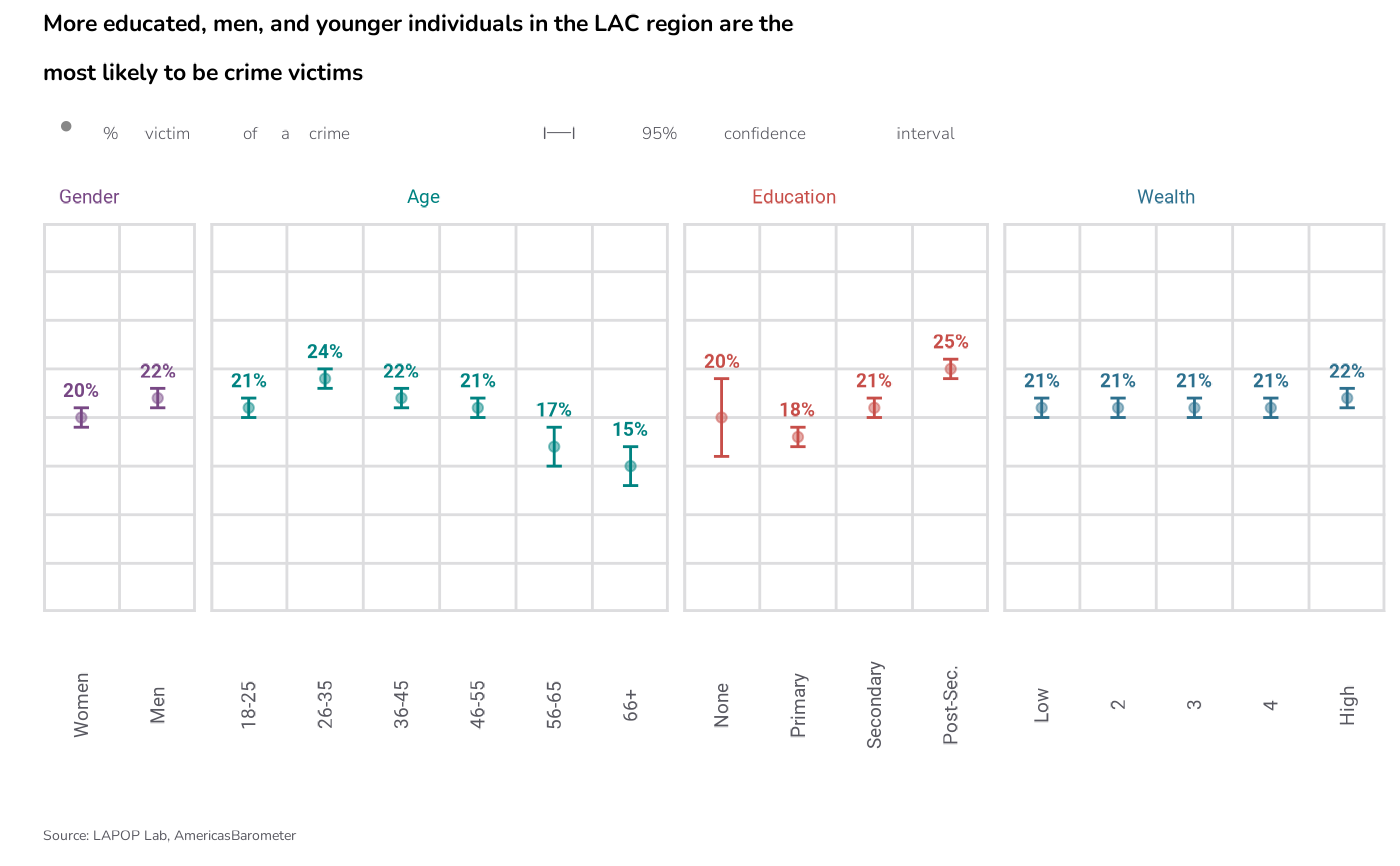
df <- data.frame(varlabel = c(rep("Gender", 2), rep("Age", 6),
rep("Education", 4), rep("Wealth", 5)),
vallabel = c("Women", "Men", "18-25", "26-35", "36-45",
"46-55", "56-65", "66+", " None", "Primary",
"Secondary", "Post-Sec.", "Low", "2",
"3", "4", "High"),
prop = c(20, 22, 21, 24, 22, 21, 17, 15, 20, 18, 21, 25, 21,
21, 21, 21, 22),
proplabel = c("20%", "22%", "21%", "24%", "22%", "21%",
"17%", "15%", "20%", "18%", "21%", "25%",
"21%", "21%", "21%", "21%", "22%"),
lb = c(19, 21, 20, 23, 21, 20, 15, 13, 16, 17, 20, 24, 20,
20, 20, 20, 21),
ub = c(21, 23, 22, 25, 23, 22, 19, 17, 24, 19, 22, 26, 22,
22, 22, 22, 23))
require(lapop); lapop_fonts
#> function ()
#> {
#> .lapop_register_fonts()
#> showtext::showtext_auto(enable = TRUE)
#> message("LAPOP fonts loaded successfully: Inter and Inter Light.")
#> invisible(TRUE)
#> }
#> <bytecode: 0x56483b710688>
#> <environment: namespace:lapop>
lapop_mover(df,
main_title = paste0("More educated, men, and younger individuals",
" in the LAC region are the\nmost likely",
" to be crime victims"),
subtitle = "% victim of a crime", qword = "",
source_info = "Source: LAPOP Lab, AmericasBarometer",
ymin = 0,
ymax = 40)
 # }
# }