LAPOP Time-Series Graphs
lapop_ts.RdThis function creates time series graphs using LAPOP formatting. If there are waves missing at the beginning or end of the series, the function will omit those waves from the graph (i.e., the x-axis will range from the earliest wave for which data is supplied to the latest). If there are waves missing in the middle of the series, those waves will be displayed on the x-axis, but no data will be shown.
Usage
lapop_ts(
  data,
  outcome_var = data$prop,
  lower_bound = data$lb,
  upper_bound = data$ub,
  wave_var = as.character(data$wave),
  label_var = data$proplabel,
  point_var = data$prop,
  ymin = 0,
  ymax = 100,
  main_title = "",
  source_info = "LAPOP",
  subtitle = "",
  lang = "en",
  color_scheme = "#A43D6A",
  percentages = TRUE,
  label_vjust = -2.1,
  max_years = 15,
  label_angle = 0,
  ci_type = "linerange"
)
Arguments
- data
Data Frame. Dataset to be used for analysis. The data frame should have columns titled wave (survey wave/year; character vector), prop (outcome variable; numeric), proplabel (text of outcome variable; character); lb (lower bound of estimate; numeric), and ub (upper bound of estimate; numeric). Default: None (must be supplied).
- wave_var, outcome_var, label_var, lower_bound, upper_bound, point_var
Character, numeric, character, numeric, numeric, character. Each component of the data to be plotted can be manually specified in case the default columns in the data frame should not be used (if, for example, the values for a given variable were altered and stored in a new column).
- ymin, ymax
Numeric. Minimum and maximum values for y-axis. Default: 0, 100.
- main_title
Character. Title of graph. Default: None.
- source_info
Character. Information on dataset used (country, years, version, etc.), which is added to the bottom-left corner of the graph. Default: LAPOP ("Source: LAPOP Lab" will be printed).
- subtitle
Character. Describes the values/data shown in the graph, e.g., "Percent of Mexicans who agree...". Default: None.
- lang
Character. Changes default subtitle text and source info to either Spanish or English. Will not translate input text, such as main title or variable labels. #' Takes either "en" (English) or "es" (Spanish). Default: "en".
- color_scheme
Character. Color of lines and dots. Takes hex number, beginning with "#". Default: "#A43D6A" (red).
- percentages
Logical. Is the outcome variable a percentage? Set to FALSE if you are using means of the raw values, so that the y-axis adjusts accordingly. Default: TRUE.
- label_vjust
Numeric. Customize vertical space between points and their labels. Default: -2.1.
- max_years
Numeric. Threshold for automatic x-axis label rotation. When the number of unique country labels exceeds this value, labels will be smaller and if necessary rotated for better readability. Default: 15 years.
- label_angle
Numeric. Angle (in degrees) to rotate x-axis labels when max_years is exceeded. Default: 0.
- ci_type
Character. Controls how confidence intervals are displayed in the time-series plot. This parameter only affects how the confidence interval is visualized; the point estimate and line plot remain unchanged. Options:
"linerange"(default): Draws upper and lower bounds as dashed lines."errorbar": Displays confidence intervals using vertical error bars centered on the point estimate."ribbon": Shows a shaded confidence band between the lower and upper bounds."none": Suppresses confidence interval display.
Value
Returns an object of class ggplot, a ggplot line graph showing
values of a variable over time.
Details
The input data must have a specific format to produce a graph. It must include columns for the survey wave (wave), the outcome variable (prop), the lower bound of the estimate (lb), the upper bound of the estimate (ub), and a string for the outcome variable label (proplabel).
Author
Luke Plutowski, luke.plutowski@vanderbilt.edu & Robert Vidigal, robert.vidigal@vanderbilt.edu
Examples
# \donttest{
require(lapop); lapop_fonts()
#> LAPOP fonts loaded successfully: Inter and Inter Light.
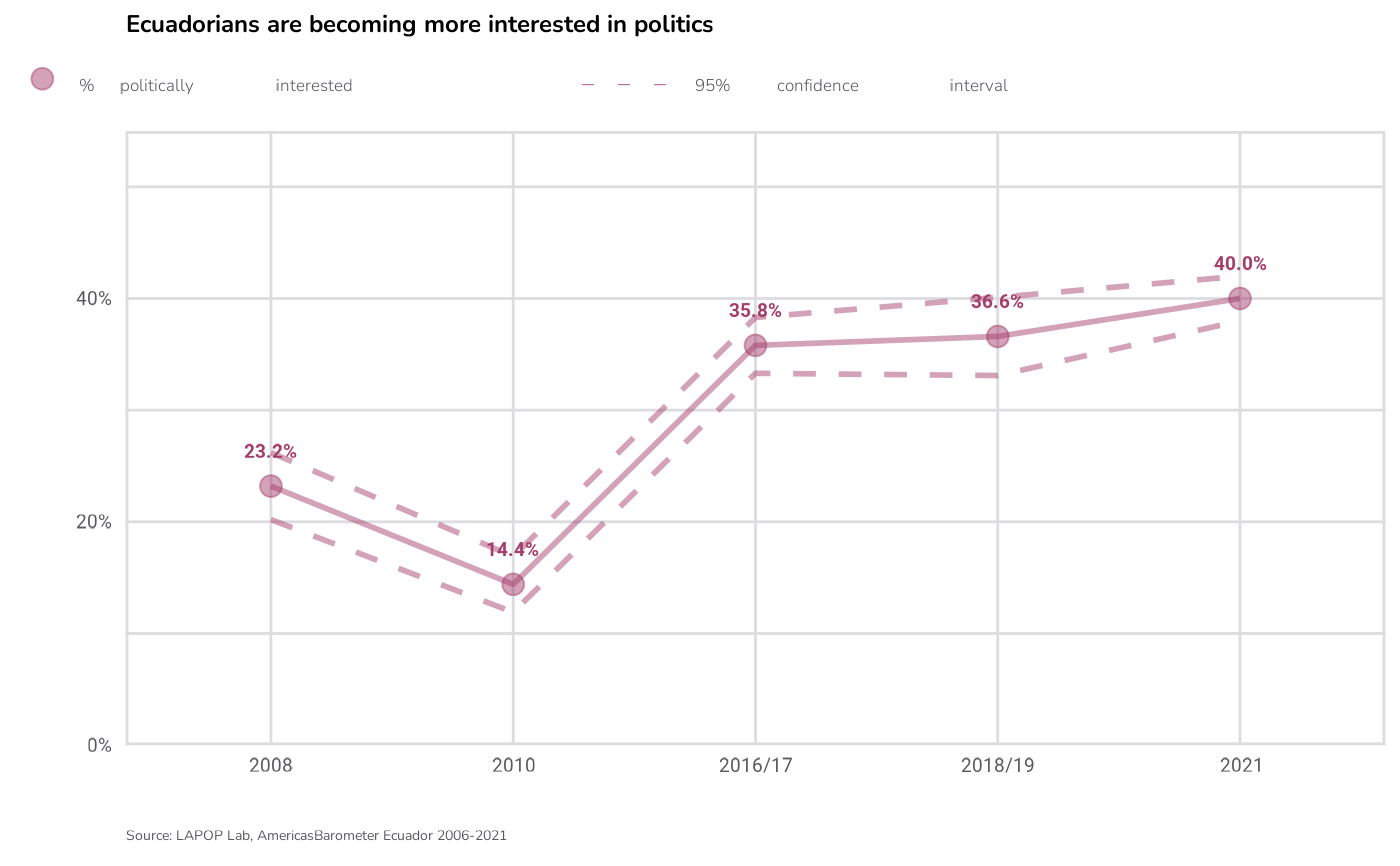
df <- data.frame(wave = c("2008", "2010", "2016/17", "2018/19", "2021"),
prop = c(23.2, 14.4, 35.8, 36.6, 40),
proplabel = c("23.2%", "14.4%", "35.8%", "36.6%", "40.0%"),
lb = c(20.2, 11.9, 33.3, 33.1, 38),
ub = c(26.2, 16.9, 38.3, 40.1, 42)
)
lapop_ts(df,
main_title = "Ecuadorians are becoming more interested in politics",
subtitle = "% politically interested",
source_info = "Source: LAPOP Lab, AmericasBarometer Ecuador 2006-2021",
ymin = 0,
ymax = 55)
 # }
# }